Shifting Consumer Behavior: How Google Trend Data Reveals Medicare Advantage Growth and Opportunities for More Informed Plan Choices
Amy Tramontozzi, MS; Gregory Downing, DO, PhD; Lucas Tramontozzi, MPH
BACKGROUND
Medicare Advantage (MA) enrollment now exceeds half of all Medicare beneficiaries and continues to climb in 2025.1 This surge is driven in part by intensive direct-to-consumer marketing, including television ads, broker outreach, and search engine optimization by private insurers. Commercial entities dominate the digital and media landscape during enrollment periods, often outpacing public sources like Medicare.gov in visibility and accessibility.2
For many older adults, decisions about MA plans are influenced more by advertising than by informed evaluation of plan quality, cost, or network coverage. Research shows seniors frequently select plans based on marketing messages or broker advice—rather than long-term value or personal health needs.3 This can have serious consequences.
When beneficiaries with chronic conditions choose plans based on marketing rather than suitability, they may face higher out-of-pocket expenses, restrictive provider networks, and care disruptions. Once enrolled, switching back to traditional Medicare can be difficult or even impossible in many states due to supplemental insurance underwriting rules.4
Importantly, marketing appears to be working. Studies suggest that MA plan advertising significantly shapes enrollment behavior and may be fueling disproportionate uptake in certain regions and vulnerable subpopulations. While MA plans offer benefits like reduced premiums and supplemental services, not all beneficiaries realize that these trade-offs can mask narrower access or more stringent utilization management.
Given this complex landscape, Google Trends offers a novel, scalable way to monitor real-time consumer behavior, revealing how search patterns correlate with marketing efforts, enrollment cycles, and geographic disparities. This study uses Google Trends data to better understand the timing, intensity, and regional variation in Medicare Advantage search activity—and to inform more equitable, data-driven strategies for consumer engagement and oversight.
Objective
To understand the impact of MA marketing campaigns on consumer health plan enrollment choices through the use of large consumer-based datasets and innovative analytic methods.
Methods
Study Design and Data Collection
We conducted a retrospective time series analysis of public search behavior related to MA using Google Trends, a public tool that measures the relative frequency of online search terms, data from January 2004 to March 2024, building off the work of Szewczyk and Zygmunt5 who explored seasonal patterns in Polish public interest in travel insurance and the European Health Insurance Card. The study utilized Relative Search Volume (RSV) scaled from 0 to 100, where 100 represents peak search interest during the observed period. RSV was also evaluated for correlations with MA Enrollment data from CMS’ Medicare Enrollment Dashboard and commercial marketing data from Wesleyan Media Project by Vivvix (formerly Kantar) CMAG.
Search Term Selection & Data Processing
- Primary search terms: “Medicare Advantage”, “Medicare Advantage Plans”, and “Medicare Insurance Plans”
- Singular and plural variations were combined into single time series
- Data were renormalized by dividing all values by the mean of the respective time series
- Terms were selected using prior literature, health marketing taxonomies, and input from Medicare search toolkits and advisors.
- Analysis included only periods with non-zero search values to ensure robust modeling
Seasonal AutoRegresive Moving Average (SARIMA) Model Validation
- Auto-SARIMA selected: ARIMA(1,1,1)(0,1,1)[12]
- Model parameters: AR(1)=0.806, MA(1)=-1.192, MA(2)=0.219, Seasonal MA(1)=-0.276
- Model fit metrics: AIC
Statistical Analysis Holt-Winters Exponential Smoothing (Multiplicative Model)
- Applied multiplicative rather than additive model due to seasonal variations scaling with overall search volume
- Decomposed time series into:
- Level Component: The baseline value of the time series at any given point, representing the overall magnitude of the data after removing short-term fluctuations
- Trend Component: The long-term direction or movement in the data over time, showing whether search interest is generally increasing, decreasing, or remaining stable
- Seasonal Component: The repeating, periodic fluctuations in the data that occur at regular intervals (12 months)
- Generated 24-month forecasts to assess predictive capability
Comparative Analysis
- Benchmarked MA-related terms against “car insurance” and “life insurance” to differentiate health-specific seasonal effects from broader insurance search behavior
- Examined weekly seasonality patterns within peak months (November) for 2014 vs. 2024
Google Trends “interest by subregion” data were used to map RSV variation across U.S. states - Patterns were compared with known marketing intensity, broker density, and regional plan availability as described in policy and media reports
Interpretive Framework
- To contextualize behavioral patterns, we reviewed evidence on:
- MA plan marketing practices (including TV ads, broker incentives, and social media),
- Consumer decision-making limitations, and
- The disparity between actual plan needs and marketed plan features.
Results
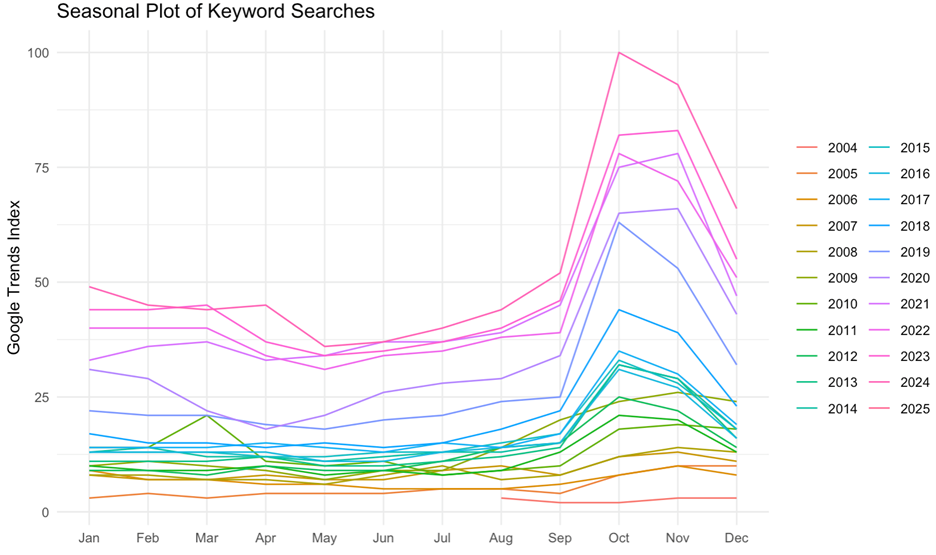
Finding 1: Pronounced Seasonal Patterns with Quantified Peak Activity
Monthly Seasonal indices (“Medicare Advantage)
- October peak: 1.703 (70% above baseline)
- November peak: 1.641 (64% above baseline)
- Lowest activity in May: 0.718 (28% below baseline)
- Seasonal range: 0.718-1.703 (98.5% variation from trough to peak)
- “Medicare Advantage Plans”: October index 1.898 (90% above baseline)
- “Medicare insurance Plans”: November index 1.550 (55% above baseline)
- Control comparison – “Car Insurance”: Range 0.881-1.075 (22% variation)
- Control comparison – “Life Insurance”: Range 0.898-1.095 (22% variation)
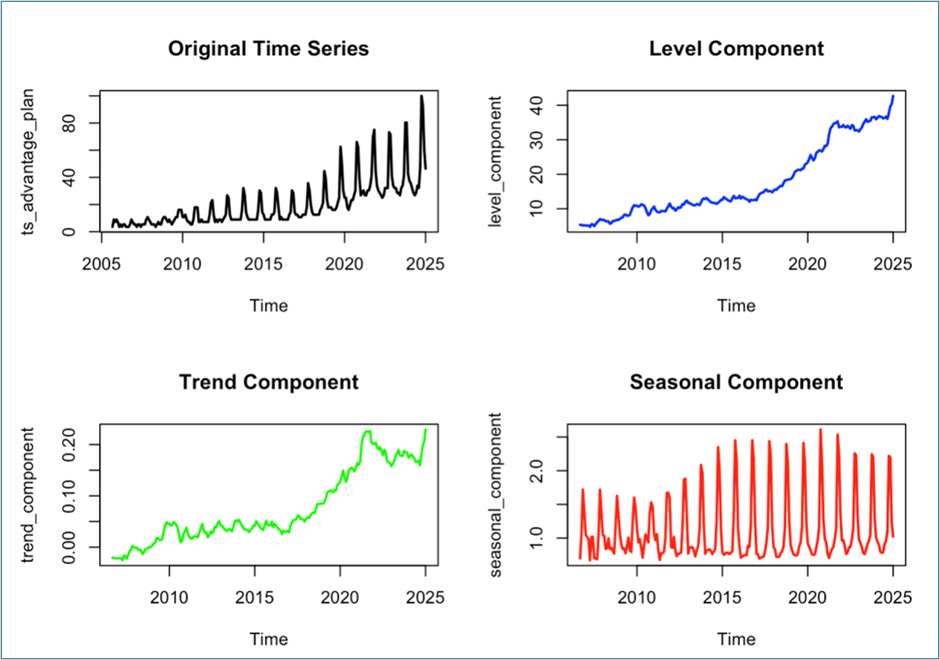
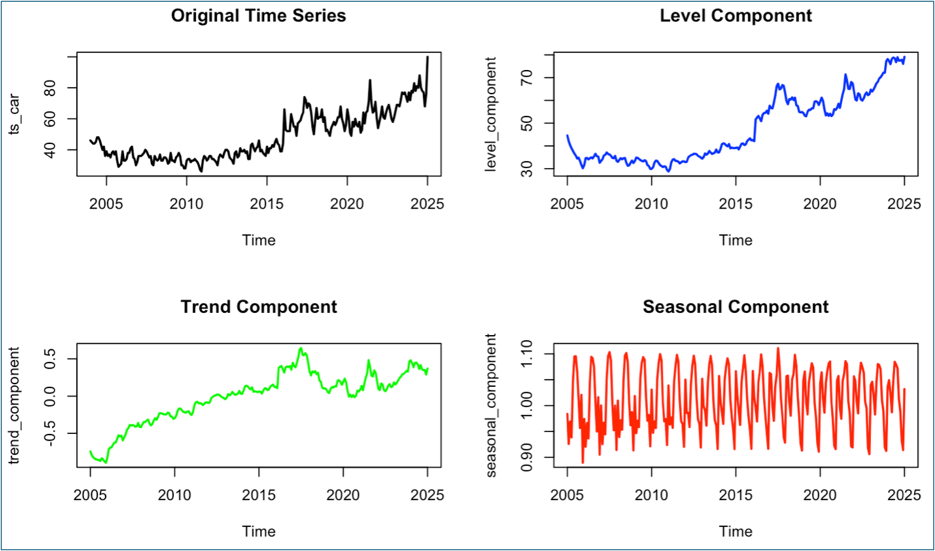
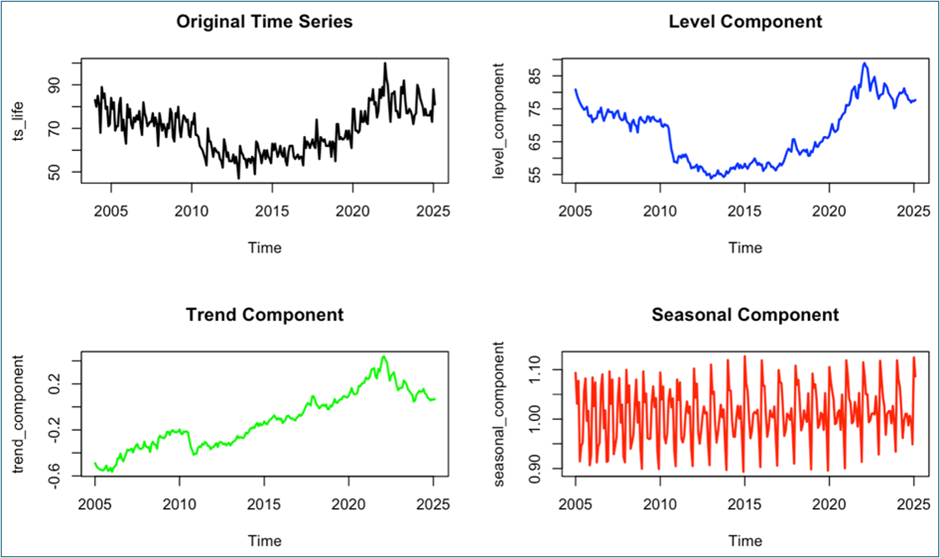
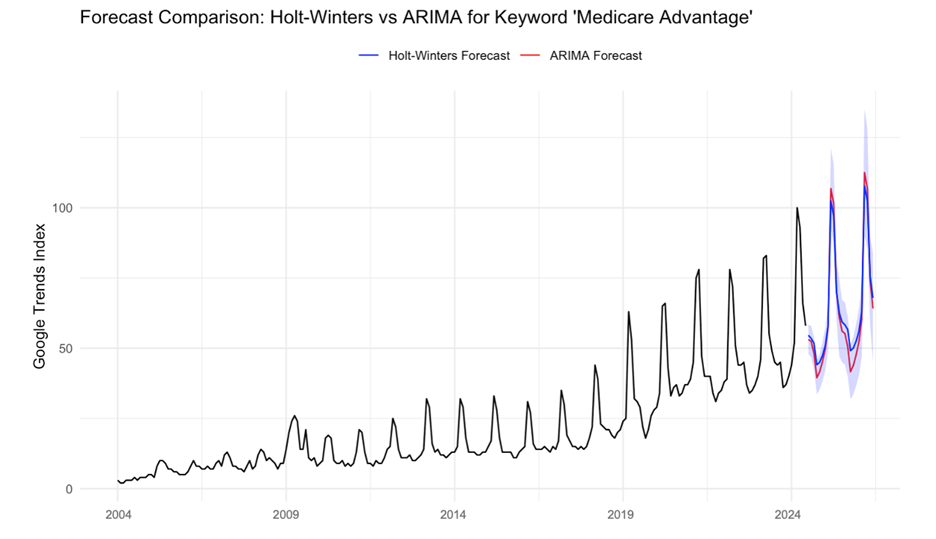
Finding 2: Quantified Growth Trajectories Exceeding Control Terms
- Medicare Advantage search interest increased 200% from 2020-2024
- Trend component shows consistent positive growth since 2005
- Growth rate significantly exceeds car insurance (relatively flat trend since 2020) and life insurance (modest decline)
- SARIMA forecasts within 95% confidence intervals of Holt-Winters predictions(22% variation)
Finding 3: Evolving Weekly and Geographic Search Patterns
2014 Weekly Patterns:
- Tuesday peak 1.316 (32% above weekly average)
- Weekend trough: Sunday 0.633 (37% below average)
- Weekday/weekend ratio: 2.08:1
2024 Weekly Patterns:
- Tuesday/Thursday peaks: 1.194 (19% above average)
- Weekend trough: Sunday 0.588 (44% below average)
- Weekday/weekend ratio: 2.14:1
- Pattern shows more distributed weekday activity vs concentrated early-week peaks
- 2015: Concentrated regional patterns with limited national coverage
- 2020: Expanded geographic reach with intensified emerging hotspots
- 2024: Nationwide distribution with far less clustering
- High-intensity regions aligned with known broker activity and plan marketing density
- Commercial entities dominate search result pages; government portals underutilized
- Notable off-cycle engagement indicating year-round interest
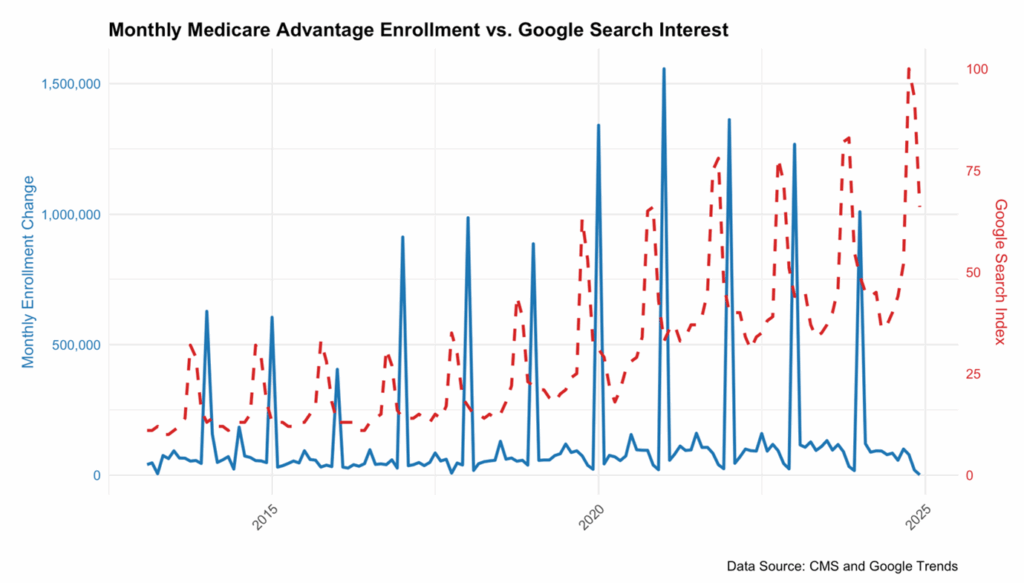
Finding 4: Search Behavior Aligns with Enrollment and Advertising Patterns
- Google search spikes coincide with Medicare Advantage enrollment surges.
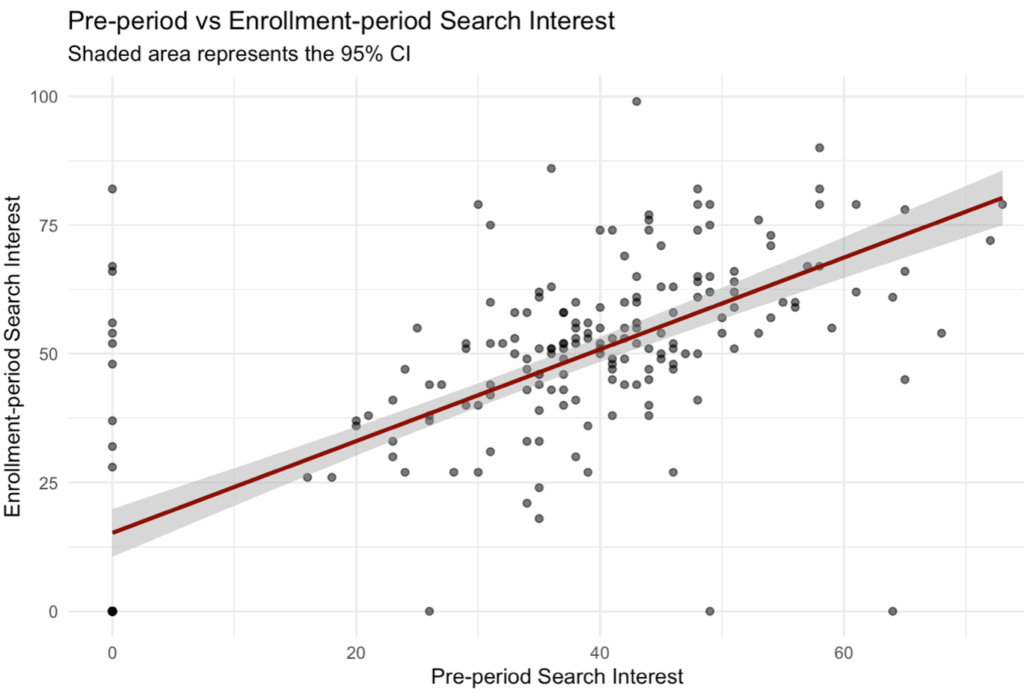
- Higher ad volume regions show greater Medicare search interest. (pre-enrollment r=0.34, enrollment p<0.0001)
- Pre-enrollment ads correlate with in-season search activity increases.
- Regression confirms a 1% increase in ad volume was associated with a 0.035-point increase in search volume.
- Search trends reflect marketing intensity and consumer engagement levels.
CONCLUSION
Internet search behavior is no longer peripheral to health policy. Medicare Advantage search patterns are not only seasonal but predictive, sustained, and shaped by aggressive marketing ecosystems. Yet public infrastructure to guide consumer choices online remains dangerously underdeveloped. By leveraging Google Trends as a real-time surveillance tool, policymakers can track shifts in awareness, respond to emerging misinformation, and design smarter, equity-driven engagement strategies.
Policy Implications
- Google Trends can serve as a near real-time proxy for consumer awareness and marketing saturation.
- Findings support development of neutral, accessible online decision tools.
- Seasonal marketing should be supplemented with continuous engagement efforts.
- Enhanced digital literacy is needed to reduce reliance on brokers and mitigate misleading marketing.